


Look now · monitor & understand

insight

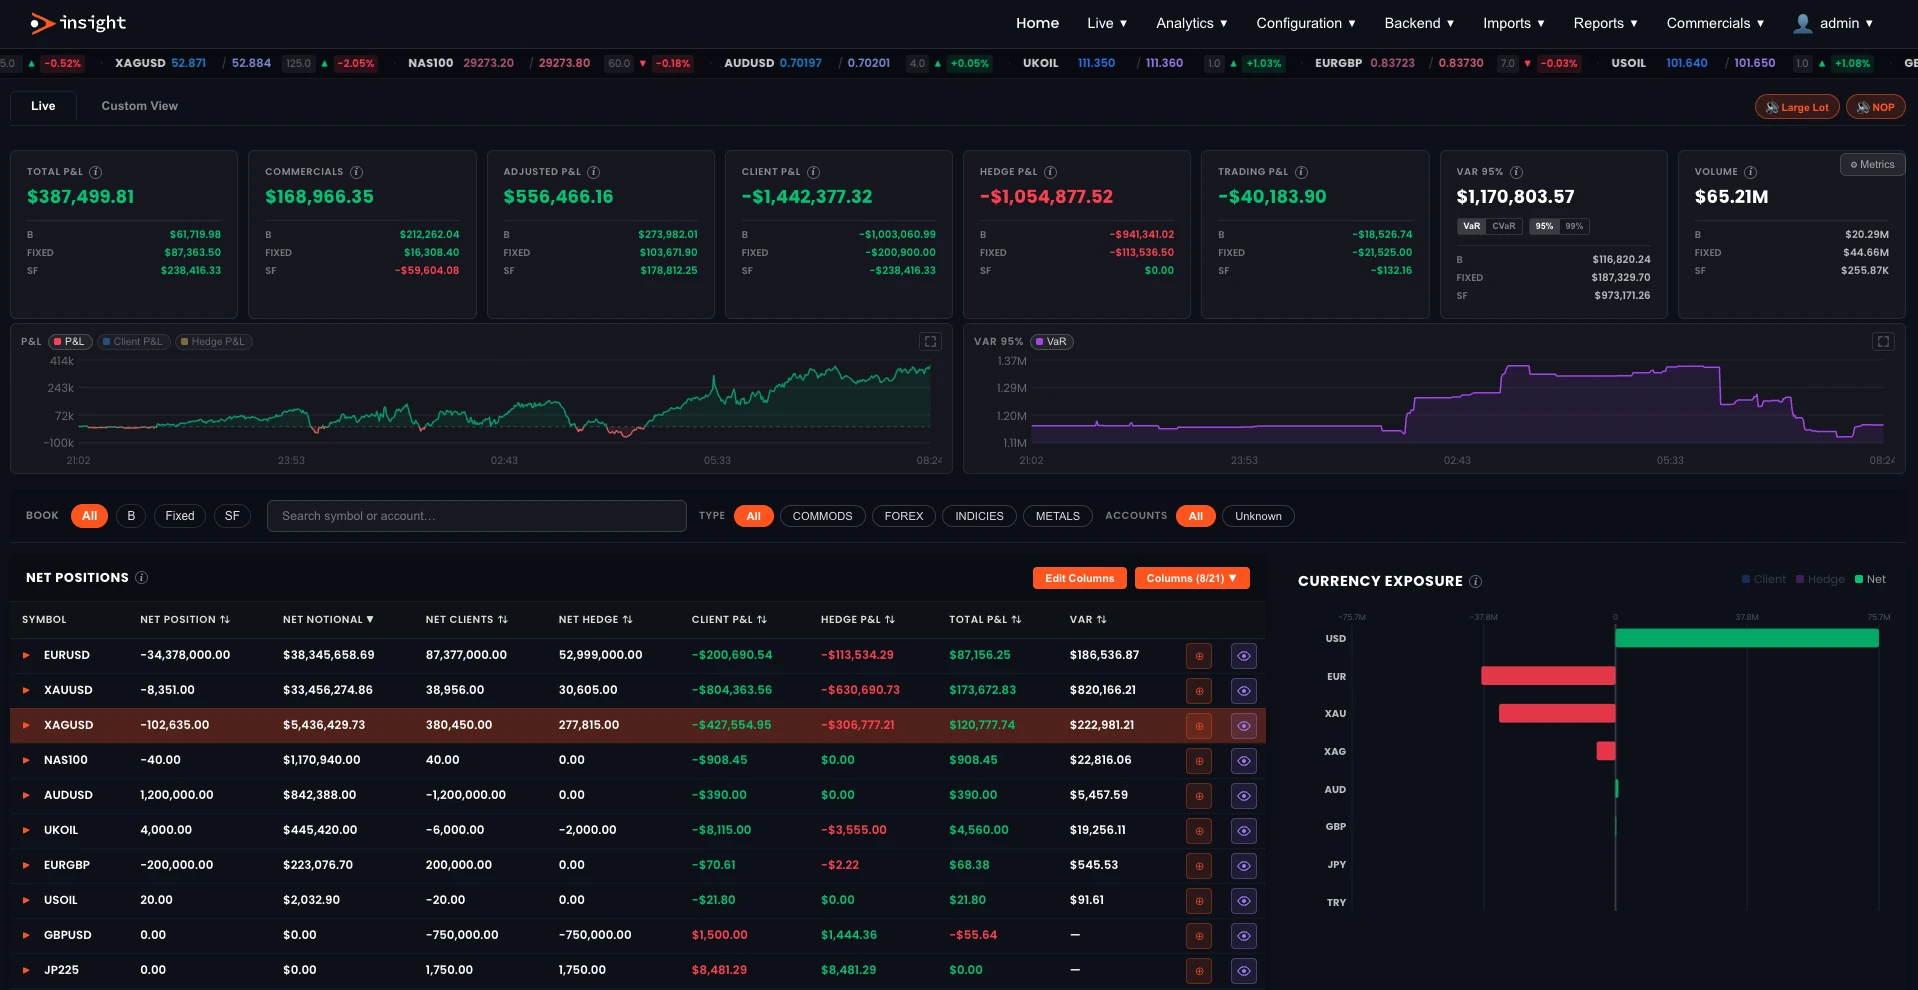
The live book view. Real-time exposure, positions, pricing and client activity, aggregated across every book and venue and refreshed continuously.

What it does
  • Real-time exposure, P&L and VaR
  • Volatility bands and live price feeds
  • Hedger monitor and client flags
insight · Exposure

Your whole book, live, on one screen

Net positions, P&L, VaR, volume, commission and spread across every account, book and venue, split by client and hedge legs and pivotable on book, symbol type and account type. Save the layout as a personal or shared Custom View.
Sub-second exposure engineEvery tile is configurable and clickable, opening the rows behind the number.
Breach & connection awarenessHedge limits colour each breach, and the Connections tile means a stale feed is never mistaken for a flat book.
The insight live exposure dashboard: a streaming price ticker above tiles for total, commissions, adjusted, client, hedge and trading P&L, VaR and volume, each split by B, Fixed and SF books, with P&L and VaR time-series charts, book and symbol-type filters, and a net positions table by symbol beside a currency exposure chart.
Inside insight

Is this move normal, is every feed live, and is the hedger working?

The questions a desk asks a hundred times a day, each answered on one screen, with the context needed to understand what is happening as it happens.

Volatility

Per-symbol realised volatility, used to judge whether current market conditions are normal. Standard deviations come from actual 5, 10, 30 and 60-minute returns, and the current move is measured against them.

  • Upper / lowerThe expected band at your chosen confidence, from 50% to 99.9%.
  • Now / ±%The current move, and how far it sits outside the band.
  • ProbHow unlikely what is happening is, rather than a raw z score.
  • Daily VaREach symbol's contribution to one-day VaR, for ordering.
  • SkewPer-symbol pricing skew, viewable and adjustable from the panel.
Live › Risk Management

Price Feeds

Top-of-book prices from every feed that publishes them, trading platforms and LP connections side by side, with the best bid and ask across sources highlighted. FIX sessions to cTrader, PrimeXM, FT Hub and Centroid are configured in the app and reload without a restart.

  • Compare viewBid, ask, spread and age for each source, one row per symbol.
  • Latency alertA source quoting behind the freshest quote from another source.
  • Arbitrage alertA fresh bid on one source above a fresh ask on another.
  • Stale quotesGreyed out and excluded from best bid and ask.
Live › Risk Management

Hedger

The live monitor for the automated hedging engine: what it is doing now, what it has done, and what it cost. The service bar shows whether the engine is running, armed or disarmed, and carries the killswitch.

  • Rule / rungWhich hedge rule fired, and the ladder step that sized the clip.
  • Exposure vs targetCurrent exposure against the rule's target, and the residual.
  • SlippageFill price against the price the engine saw when it decided.
  • Cost per $1mExecution cost normalised, so venues and symbols compare fairly.
  • CoverageShare of client exposure that ended up hedged versus kept.
Live › Risk Management · Hedging module
One platform, three lenses

Part of a single loop

insight sits in the middle of the loop, reading the live book against what hindsight has learned and handing the signal to foresight.

Get started

See insight against your own book.

Book a 30-minute walkthrough and we'll map it to your own venues, books and clients.

Request a demo →